
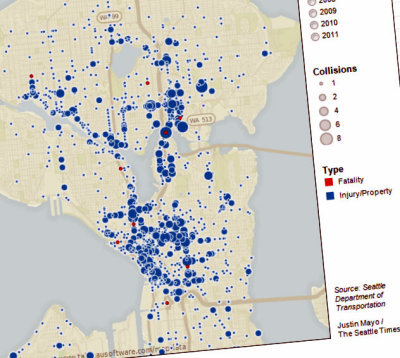
 Justin Mayo at the Seattle Times created this useful interactive map showing the locations of all traffic-related bicycle crashes from 2007 to 2011.
Posted on Saturday, the map shows larger dots for multiple crashes and red dots to locate fatalities. Based on data from the Seattle Department of Transportation, this tool could help advocates and traffic designers find bicycle routes that need special attention.
An accompanying article (“Seattle bicycle crashes holding steady even with more commuters”) reports 1,847 traffic-related bicycle crashes between 2007 and 2011 in which 10 bicycles died.
The annual crash rate has held steady between about 360 to 390 over the period, while the number of bicyclists commuting into Seattle has risen from 2,273 a day in 2007 to 3,251 in 2010, according to the city's September bicycle count.
Sam Woods, bicycle coordinator for the Seattle DOT, said there's a tendency for motorists to be more aware of bicyclists as more take to the roads. Therefore, an increase in bicycle commuting doesn't necessarily mean an increase in crashes.
Without assessing fault, the Seattle Department of Transportation figures show crossing cars hit cyclists 863 times and cyclists hit crossing cars 506 times; 159 cyclists were sideswiped.
Advocates and traffic planners are working on several plans to make streets safer. Bike lanes, bike paths, separated bike lanes, sharrows, and greenways are being considered and installed in and around Seattle.
One of the newest safety measures to be employed are bicycle greenways. More about neighborhoods that are pressing for them can be seen at Seattle Bike Blog (“Neighborhood greenways groups multiplying”).
Recent Comments